Creating a report
Editing your generated data prior to the analysis and even prior to the collection, serves multiple purposes. Creating a HTML report allows for discussions within the classroom and it is a good debriefing tool. To get a structured output that can be used for further data analysis you can define a CSV report as well.
CAUTION: Notice that there is no opening tab at the beginning and there is an opening php tag at the end of most reports. The report initially starts with PHP code, as a report is intended to work with generated data. Therefore, no PHP tags are required in CSV report.
HTML Report
A HTML report visualizes experiment results to participants and there are multiple ways to encourage interaction with your participants. Graphs and tables are fast and intuitive options to display information for a better understanding of the results.
You are not limited to any of these options though. You can use most of the options that HTML, PHP or JavaScript provide.
Tables
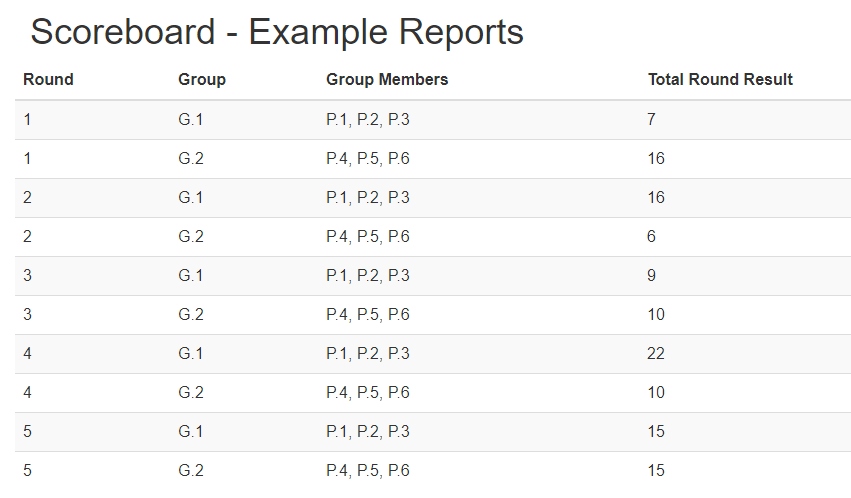
Most of the time tables are used to display a scoreboard and measure participants performance. This can be accomplished by using plain HTML tables in combination with some PHP code. Retrieve the gathered data and display the information as in the example code below.
$session = $context->getSession();
$stepgroupLoops = $stepgroupApi->getLoops('main');
$groups = $groupApi->getGroupLabels();
?>
<link href="https://maxcdn.bootstrapcdn.com/bootstrap/3.3.7/css/bootstrap.min.css" rel="stylesheet" integrity="sha384-BVYiiSIFeK1dGmJRAkycuHAHRg32OmUcww7on3RYdg4Va+PmSTsz/K68vbdEjh4u" crossorigin="anonymous">
<div class="container">
  <div class="row">
    <div>
        <h1>Scoreboard - <?= htmlentities($session['name']); ?>
  </div>

  <div class="row">
    <div>
      <table id="scoreboard" class="table table-striped table-hover">
        <thead>
          <tr>
          <th>Round</th>
          <th>Group</th>
          <th>Group Members</th>
          <th>Total Round Result</th>
          </tr>
        </thead>
        <tbody>
          <?php
          for ($i = 1; $i <= $stepgroupLoops; $i++)
          {
            foreach ($groups as $group)
            {
              $groupMembers = $groupApi->getGroupMemberLabels($group, array('stepgroupLabel' => 'main', 'stepgroupLoop' => $i));
              $roundResult = 0;
              foreach ($groupMembers as $groupMember)
              {
                $roundResult += $variableApi->getPSL('input', $groupMember, 'main', $i);
              }
          ?>

            <tr>
              <td><?= $i; ?></td>
              <td><?= $group; ?></td>
              <td><?= $groupMembers[0] . ', ' . $groupMembers[1] . ', ' . $groupMembers[2]; ?></td>
              <td><?= $roundResult; ?></td>
            </tr>
          <?php
            }
          }
          ?>
        </tbody>
      </table>
    </div>
  </div>
</div><?php
The screenshot of the table below is the result of the example code. You can extend the functionality of a table by using jquery datatables. That offers multiple functionality like ordering, paging and limited entries per page. To get further information visit the datatables website.

Graphs
You can include various types of graphs using the Chart.js library for example. Simply use the following cdn to include Chart.js in your report.
https://cdnjs.cloudflare.com/ajax/libs/Chart.js/2.6.0/Chart.bundle.min.js
Below you can see an example of Chart.js included in a HTML report. This report shows the total values entered by group. Simply set up an array of data that should be displayed in the graph to get this results. The only requirements for this code to work is a PSL variable named input, which contains a number and the label of the containing stepgroup needs to be called ‘main’.
$groups = $groupApi->getGroupLabels();
$stepgroupLoops = $stepgroupApi->getLoops('main');
$groupResults = array();

  foreach ($groups as $group)
  {
    $roundResult = 0;
    for ($i = 1; $i <= $stepgroupLoops; $i++)
    {
      $groupMembers = $groupApi->getGroupMemberLabels($group, array('stepgroupLabel' => 'main', 'stepgroupLoop' => $i));
      foreach ($groupMembers as $groupMember)
      {
        $roundResult += $variableApi->getPSL('input', $groupMember, 'main', $i);
      }
    }
    $groupResults[] = $roundResult;
  }
?>
<html>
  <head>
    <script type="text/javascript" src="https://cdnjs.cloudflare.com/ajax/libs/Chart.js/2.6.0/Chart.bundle.min.js">
    </script>
  </head>
  <body>
    <canvas id="myChart" width="1000" height="1000"></canvas>
    <script>
      var ctx = document.getElementById("myChart").getContext('2d');
      var myChart = new Chart(ctx, {
      type: 'bar',
      data: {
        labels: <?= json_encode($groups); ?> ,
          datasets: [{
            label: 'Total Value',
            data: <?= json_encode($groupResults); ?>,
              backgroundColor: [
                'rgba(255, 99, 132, 0.2)',
                'rgba(54, 162, 235, 0.2)',
                'rgba(255, 206, 86, 0.2)',
                'rgba(75, 192, 192, 0.2)',
                'rgba(153, 102, 255, 0.2)',
                'rgba(255, 159, 64, 0.2)'
              ],
                borderColor: [
                  'rgba(255,99,132,1)',
                  'rgba(54, 162, 235, 1)',
                  'rgba(255, 206, 86, 1)',
                  'rgba(75, 192, 192, 1)',
                  'rgba(153, 102, 255, 1)',
                  'rgba(255, 159, 64, 1)'
                ],
                  borderWidth: 1
          }]
      },
        options: {
          scales: {
            yAxes: [{
              ticks: {
                beginAtZero:true
              }
            }]
          }
        }
      });
    </script>
  </body>
</html><?php
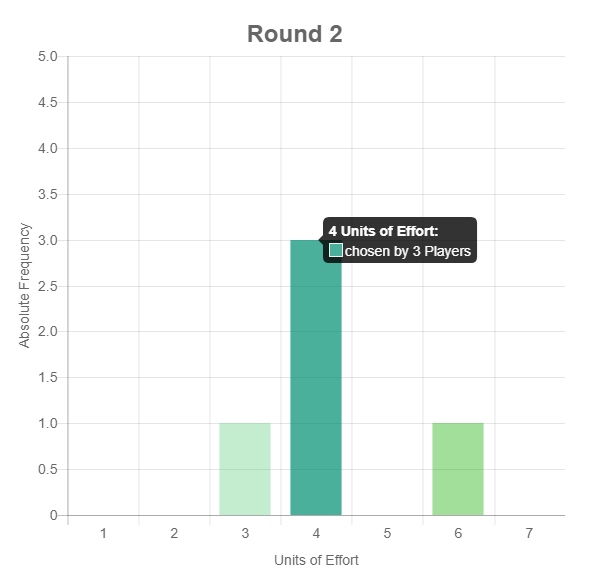
In the Screenshot below you can see the output for a simple graph of a Minimum Effort Game played by five players in the same group. Tooltip information as well as step size and labels for the axes are configurable options, which are listed in the Chart.js documentation. You can display information for each round and show your participants their performance.

CSV Report
The easiest way to extract and structure data is through a CSV report. Although the functionality to export gathered data in CSV format is already available in the Session Administration of SoPHIE, there might be situations, where an individual report is necessary.
Using such a report helps formatting the data to a level, where you can directly import the information to your data analysis software. This will save a lot of time and it prevents mistakes, once the report is finished.
$groups = $groupApi->getGroupLabels();
echo 'Group;Round;' . PHP_EOL;
for ($i = 1; $i <= 5; $i++)
{
  foreach($groups as $group)
  {
      $groupNumber = explode(".", $group);

      echo $group . ';';
      echo $i . ';';
      echo PHP_EOL;
  }
}
Download Examples
We prepared an experiment for you, which includes all shown reports. That way you can test the reports and adjust them to your needs. Create a session with multiple groups, each group consists of three participants.
Debugging & Troubleshooting
There are three places to look at, when you encounter error messages during the creation or testing of your report. The application.log, which you can access through the Aministration interface, the session.log, which is shown in the Session Administration or the console of your browser.
Have a look at the application.log whenever there is an “Uncaught Fatal Application Error” or an “Internal server error (500)” in your browser console. The error will be displayed in the log and most of the time easy to comprehend.
The session.log displays error messages, warnings or notices, based on the problems that occured. At least error messages and warnings should be solved, as they are intentionally logged by the system and these messages are referring to false usage of API and much more.
The browser console should be consulted, if there is no error message in the session.log, but the report is not displayed correctly.