HTML Report
A HTML report visualizes experiment results to participants and there are multiple ways to encourage interaction with your participants. Graphs and tables are fast and intuitive options to display information for a better understanding of the results.
You are not limited to any of these options though. You can use most of the options that HTML, PHP or JavaScript provide.
Tables
Most of the time tables are used to display a scoreboard and measure participants performance. This can be accomplished by using plain HTML tables in combination with some PHP code. Retrieve the gathered data and display the information as in the example code below.
$session = $context->getSession();
$stepgroupLoops = $stepgroupApi->getLoops('main');
$groups = $groupApi->getGroupLabels();
?>
<link href="https://maxcdn.bootstrapcdn.com/bootstrap/3.3.7/css/bootstrap.min.css" rel="stylesheet" integrity="sha384-BVYiiSIFeK1dGmJRAkycuHAHRg32OmUcww7on3RYdg4Va+PmSTsz/K68vbdEjh4u" crossorigin="anonymous">
<div class="container">
  <div class="row">
    <div>
        <h1>Scoreboard - <?= htmlentities($session['name']); ?>
  </div>

  <div class="row">
    <div>
      <table id="scoreboard" class="table table-striped table-hover">
        <thead>
          <tr>
          <th>Round</th>
          <th>Group</th>
          <th>Group Members</th>
          <th>Total Round Result</th>
          </tr>
        </thead>
        <tbody>
          <?php
          for ($i = 1; $i <= $stepgroupLoops; $i++)
          {
            foreach ($groups as $group)
            {
              $groupMembers = $groupApi->getGroupMemberLabels($group, array('stepgroupLabel' => 'main', 'stepgroupLoop' => $i));
              $roundResult = 0;
              foreach ($groupMembers as $groupMember)
              {
                $roundResult += $variableApi->getPSL('input', $groupMember, 'main', $i);
              }
          ?>

            <tr>
              <td><?= $i; ?></td>
              <td><?= $group; ?></td>
              <td><?= $groupMembers[0] . ', ' . $groupMembers[1] . ', ' . $groupMembers[2]; ?></td>
              <td><?= $roundResult; ?></td>
            </tr>
          <?php
            }
          }
          ?>
        </tbody>
      </table>
    </div>
  </div>
</div><?php
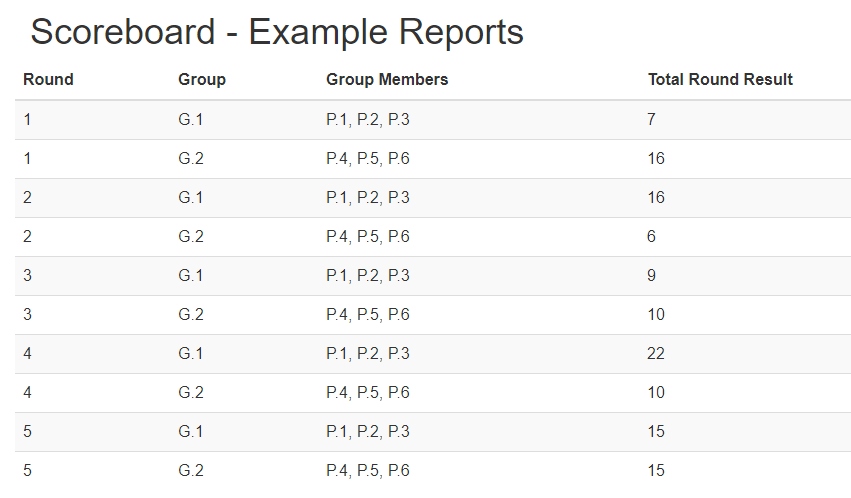
The screenshot of the table below is the result of the example code. You can extend the functionality of a table by using jquery datatables. That offers multiple functionality like ordering, paging and limited entries per page. To get further information visit the datatables website.

Graphs
You can include various types of graphs using the Chart.js library for example. Simply use the following cdn to include Chart.js in your report.
https://cdnjs.cloudflare.com/ajax/libs/Chart.js/2.6.0/Chart.bundle.min.js
Below you can see an example of Chart.js included in a HTML report. This report shows the total values entered by group. Simply set up an array of data that should be displayed in the graph to get this results. The only requirements for this code to work is a PSL variable named input, which contains a number and the label of the containing stepgroup needs to be called ‘main’.
$groups = $groupApi->getGroupLabels();
$stepgroupLoops = $stepgroupApi->getLoops('main');
$groupResults = array();

  foreach ($groups as $group)
  {
    $roundResult = 0;
    for ($i = 1; $i <= $stepgroupLoops; $i++)
    {
      $groupMembers = $groupApi->getGroupMemberLabels($group, array('stepgroupLabel' => 'main', 'stepgroupLoop' => $i));
      foreach ($groupMembers as $groupMember)
      {
        $roundResult += $variableApi->getPSL('input', $groupMember, 'main', $i);
      }
    }
    $groupResults[] = $roundResult;
  }
?>
<html>
  <head>
    <script type="text/javascript" src="https://cdnjs.cloudflare.com/ajax/libs/Chart.js/2.6.0/Chart.bundle.min.js">
    </script>
  </head>
  <body>
    <canvas id="myChart" width="1000" height="1000"></canvas>
    <script>
      var ctx = document.getElementById("myChart").getContext('2d');
      var myChart = new Chart(ctx, {
      type: 'bar',
      data: {
        labels: <?= json_encode($groups); ?> ,
          datasets: [{
            label: 'Total Value',
            data: <?= json_encode($groupResults); ?>,
              backgroundColor: [
                'rgba(255, 99, 132, 0.2)',
                'rgba(54, 162, 235, 0.2)',
                'rgba(255, 206, 86, 0.2)',
                'rgba(75, 192, 192, 0.2)',
                'rgba(153, 102, 255, 0.2)',
                'rgba(255, 159, 64, 0.2)'
              ],
                borderColor: [
                  'rgba(255,99,132,1)',
                  'rgba(54, 162, 235, 1)',
                  'rgba(255, 206, 86, 1)',
                  'rgba(75, 192, 192, 1)',
                  'rgba(153, 102, 255, 1)',
                  'rgba(255, 159, 64, 1)'
                ],
                  borderWidth: 1
          }]
      },
        options: {
          scales: {
            yAxes: [{
              ticks: {
                beginAtZero:true
              }
            }]
          }
        }
      });
    </script>
  </body>
</html><?php
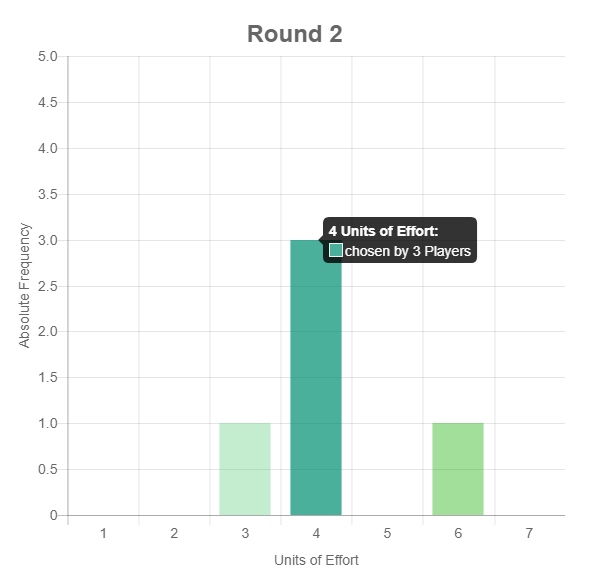
In the Screenshot below you can see the output for a simple graph of a Minimum Effort Game played by five players in the same group. Tooltip information as well as step size and labels for the axes are configurable options, which are listed in the Chart.js documentation. You can display information for each round and show your participants their performance.
